

Abstract
Introduction. T2* measurement of myocardial iron overload (MIO) is presently the gold standard for monitoring and tailoring the chelation in thalassemia patients. Native T1 mapping has been proposed also for the MIO quantification because it is known that iron can reduce native T1 values. No data are available in literature comparing T1 and T2* mapping using a segmental approach including the whole left ventricle. The goal of our study was to assess the relationship between T1 and T2* values using a segmental approach.
Methods. 29 patients with hemoglopinopathies (18 females, 45.39±13.49 years) enrolled in the Extension Myocardial Iron Overload in Thalassemia (eMIOT) Network were considered.
Native T1 and T2* images were acquired, respectively, with the Modified Look-Locker Inversion recovery (MOLLI) and with the multi-echo gradient-echo techniques. Three parallel short-axis views (basal, medium and apical) of the left ventricle (LV) were acquired with ECG-gating. The myocardial T1 and T2* distribution was mapped into a 16-segment LV model, according to the AHA/ACC model.
The lower limit of normal for each segment was established as mean±2 standard deviations on data acquired on 14 healthy volunteers.
In 25 patients also post-contrastografic images were acquired.
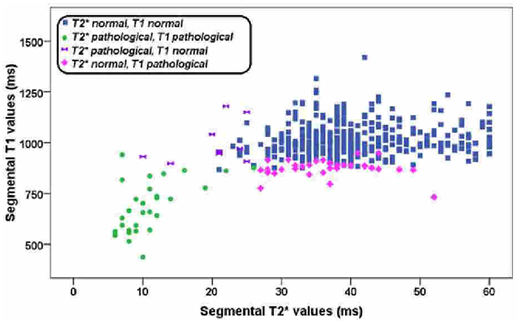
Results. T1 images showed more pronounced motion artifacts and lower contrast-to-noise-ratio, determining the exclusion of 18/464 segments. No segments were excluded by T2* mapping. So, globally, 446 segmental T1 and T2* values were considered. The mean of all segmental T2* and T1 values were, respectively, 37.83±11.30 ms and 982.72±118.24 ms.
Normal T2* and T1 values were found in 374 segments (83.9%) while 29 (6.5%) segments had pathologic T2* and T1 values. For 33 segments (7.4%) (13 patients) a pathologic T1 value was detected in presence of a normal T2* value. For 10 segments (2.2%) a pathologic T2* value was detected in presence of a normal T1 value. Out of the 9 patients with pathologic T2* values in presence of normal T1, in 7 patients post-contrastografic images were acquired; in all segments with pathologic T2* value macroscopic fibrosis by late gadolinium enhancement technique and/or microscopic fibrosis by T1 mapping were found. The relation between segmental T1 and T2* values is shown in the figure. For patients with pathologic segmental T2* values there was a linear relationship between T1 and T2* values (R=0.735, P<0.0001) while the whole data was fitted with a quadratic curve.
Conclusion. T2* and T1 mapping showed a good correlation in identifying iron by a segmental approach. However, we found a scatter between results. In 9 patients T1 mapping was not able to detect iron probably due to the presence of macroscopic and/or microscopic fibrosis that it is known to increase the native T1 . Conversely, in 13 patients T1 mapping seems to be more sensitive than T2* (sensitive to different iron chemistry or error measurements?). Further studies on larger population and correlation with clinical outcome are need.
Pepe:Chiesi Farmaceutici S.p.A., ApoPharma Inc., and Bayer: Other: No profit support.

This feature is available to Subscribers Only
Sign In or Create an Account Close Modal